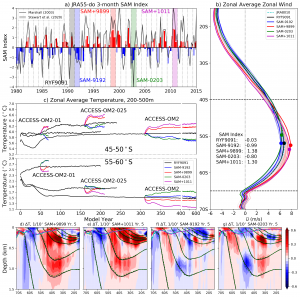
The Southern Ocean has accounted for the vast majority of the global ocean heat uptake since the early 2000s. The atmospheric winds over the Southern Ocean play a leading role in its ability to uptake heat, by way of driving much of the Southern Ocean circulation. Observations of these winds indicate that they have been steadily changing over the past few decades, and hence, so too is the Southern Ocean heat uptake. However, despite recent research efforts, the details of the Southern Ocean’s response to these changing winds remain uncertain.
In a recently submitted paper, we introduce a novel methodology to examine the Southern Ocean’s response to changing winds. We perform numerical simulations with the COSIMA model suite at all three resolutions and driven by realistic atmospheric forcing conditions. Our novel approach requires us to characterise the dynamical differences between our various realistic forcing conditions, which we do so with a new simple diagnostic. This new diagnostic proves robust in predicting the rapid response of the Southern Ocean circulation to the changing winds.
“Response of the Southern Ocean overturning circulation to extreme Southern Annular Mode conditions“; Stewart, Hogg, England & Waugh, Submitted to Geophysical Research Letters.

Figure: a) Three-monthly SAM index calculated from the JRA55-do dataset; solid bars indicate the Austral summer quarters (September-February, inclusive). The four SAMx periods are shaded, as well as the RYF9091. For comparison, the equivalent observation station-based SAM index of Marshall (2003) is included in black. b) Zonal average zonal winds for the SAMx and RYF9091 periods, with the location of the respective peaks indicated by the circles. Also included is the 1980–2010 average of the JRA55-do dataset (dashed cyan), and all remaining May–April periods between 1980–2015 coloured blue–red by their respective SAM index. c) Timeseries of the zonal average temperatures between 200–500m depth for 45–50S (upper) and 55–60S (lower); these latitudinal bands are selected to lie either side of the zonal wind speed maximum evident in (b). Distributions of the Year 5 temperature anomalies from the ACCESS-OM2-01 for (d) SAM+9899, (e) SAM+1011, (f) SAM-9192 and (g) SAM-0203 simulations. The black and dashed green contours represent the SAMx and RYF9091 isopycnals at 0.5kg/m3 intervals, respectively, with the cyan and dashed magenta contours representing the respective mixed-layer depths.